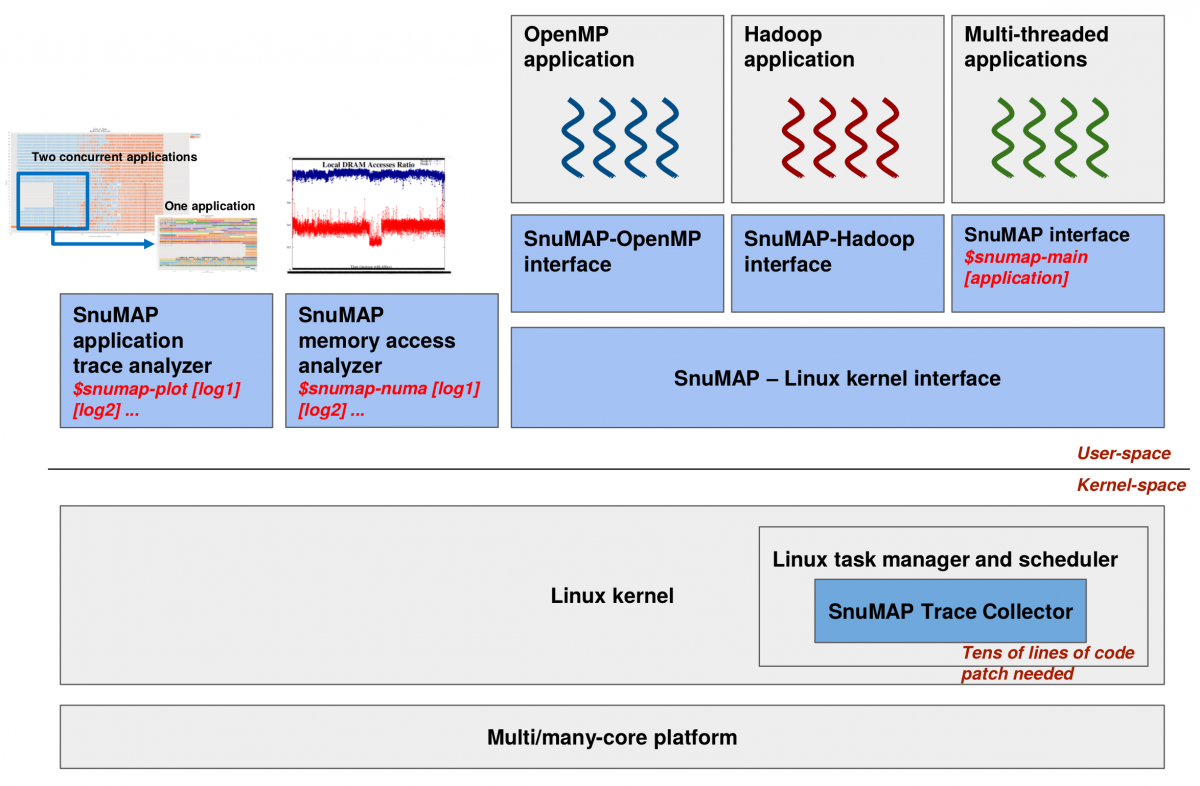
Welcome to the SnuMAP webpage. SnuMAP is an open-source OS-level multi/many-core application profiler. SnuMAP provides detailed execution trace information and easy visualization for one or multiple concurrent parallel applications that are executed on a multi/many-core platform.
To collect trace data for multi-threaded programs, SnuMAP intercepts Linux scheduler's every context switch and saves the execution times (based on Linux's jiffies) of every profiled task inside the Linux kernel. The SnuMAP framework is extensive to support various parallel programming models. Currently, we support Pthread, OpenMP and Hadoop application frameworks.

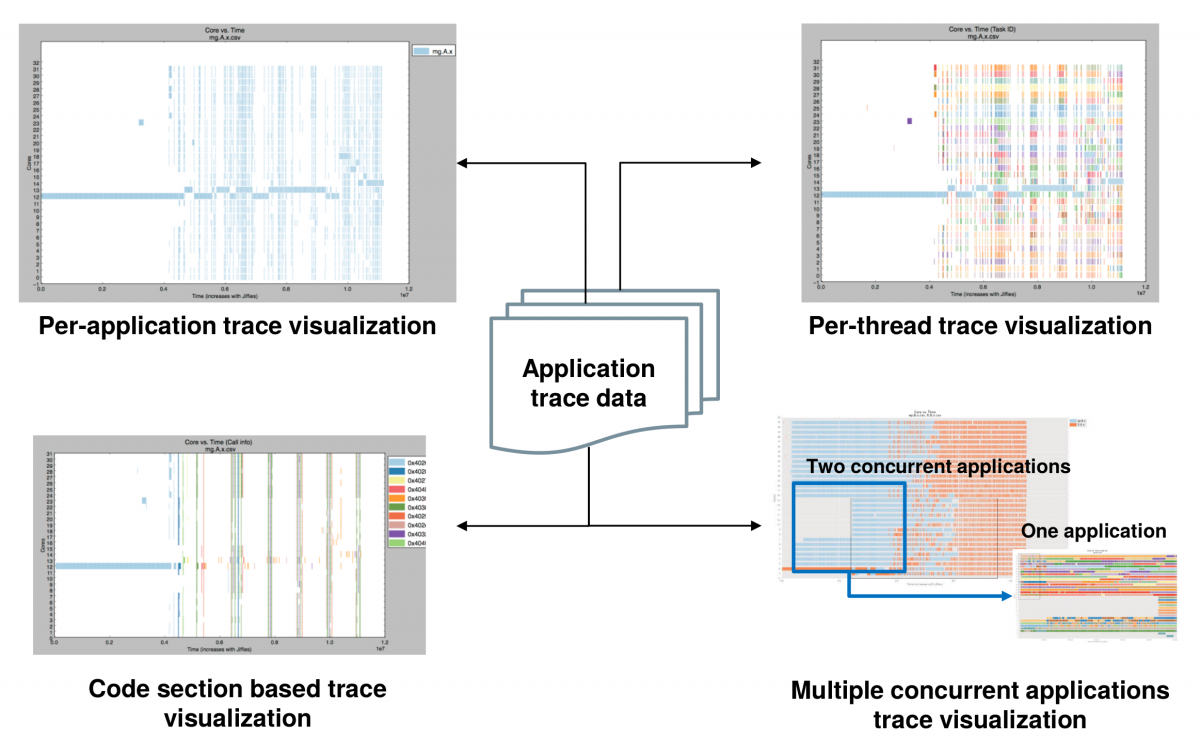
SnuMAP visualization tools have various options by using the collected trace data. For example, the tools can show per-application or per-thread trace information, and code-section based analysis. In addition, SnuMAP can visualize memory access patterns during an application lifetime for NUMA (Non-Uniform Memory Access) architectures.

How to Use SnuMAP
SnuMAP is useful for finding scheduler bugs as well as application performance bugs in multi/many-core platforms. The source code repository of SnuMAP is located at https://github.com/SnuMAP/. SnuMAP documentation (en, ko) and SnuMAP demonstration videos (solo run, mix run) is available online.
Contributors
SnuMAP is developed at Seoul National University by the Computer Systems and Platforms Laboratory under the direction of Bernhard Egger.
Younghyun Cho, Camilo A. Celis Guzman, Heesik Shin, Surim Oh, and Bernhard Egger
Contact and Bug Report
younghyun@csap.snu.ac.kr, bernhard@csap.snu.ac.kr
Last Update
July 2018
